Nowadays, majority of people prefer digital marketing as compared to the last few years. Digital marketing is the web channel that helps us create awareness of our brand, products, and services. In recent times, the approach has led to high competition in various fields. This scenario validates the need to track customer behaviour towards the product and continue a brand’s hold over the niche.
Are you wondering how this is possible? Well, Google analytics helps you with all the detailed reports about the visitors on a particular website. Let us have a look at the Google Analytics – Audience Report.
Read our article on What is Google Analytics?
Audience Report
Audience reports in Google Analytics help in understanding user perceptions. Audience reports contain sections like Active users, Lifetime value, Cohort Analysis, Audiences, User Explorer, Demographics, Interests, Geo, Behavior, Technology, Mobile, Cross-Device, Custom, Benchmarking and Users Flow. All these fragments give you a complete overview of the websites and allow you to initiate comparative analysis on the projects.
Overview
The overview in the audience reports provides the essential data that can be viewed in a single glance. The overview report shows various metrics such as the users, new users, page views, sessions, average sessions, bounce rate, and many more. The date range here is set to week by default, but one can change it to month wise view in the calendar drop-down menu (as per your analysis requirements). The overview data can be checked on an hour-by-hour, day-by-day, week-by-week, and month-by-month basis.

-
Active Users
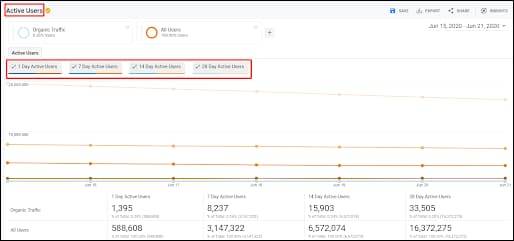
This report gives the number of new users who have visited your website in a particular period – 1day, 7 days, 14 days and 28 days, respectively. This is the most crucial report since it helps one to understand marketing effectiveness. If the number of users at day 1 is high, but the number is dropping off the expectations for the long term, it shows that one needs to make appropriate decisions in sustaining long term user engagement.
-
Lifetime Value
The lifetime value (LTV) helps marketers determine which campaigns are successful and which new tactics can be used to gain more customers back to the website. These measures could be through paid search, social media, organic, affiliates, and many more channels. LTV provides the data of users acquired in recent times based on a day, week or monthly view. LTV consists of various metrics such as Pageviews Per User, Sessions Per User, Sessions Duration Per User, Transaction Per User, Goal Completion Per User, and Revenue Per User.
Customers Lifetime Value (LTV) = Customer Value x Average Customer Lifespan

-
Cohort Analysis
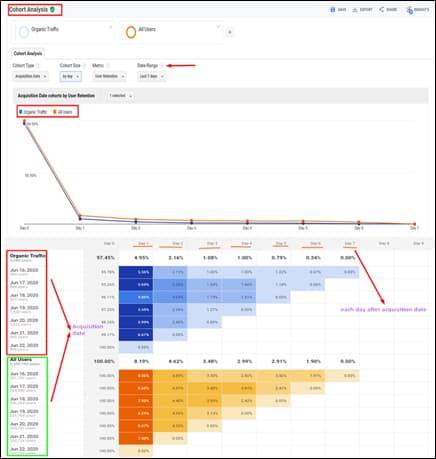
Before understanding cohort analysis, it is essential to understand what ‘cohort’ means. ‘Cohort’ is a sort of person who shares the same characteristics and behaviour of the user. Cohort analysis in Google Analytics depends on the ‘Acquisition Date’. It is segregated into four main sections:
- Cohort Type – This decides the base on which cohort needs to rely on. Google Analytics default gives only one option for this as ‘acquisition date’.
- Cohort Size – This provides the data on the basis of days, weeks and months, respectively.
- Metric – The actual data represented in the form of user retention based on various aggregated data like – goal completion per user, pageviews per user, revenue per user, and so on.
Date Range – For analysis of this report, one can choose the date range from the last 7 days, 14 days, 21 days, and 30 days.
-
Audiences
Audiences in analytics reports are the users with the collective behaviour and interests that help you in your business. These audiences could be any of the buyers or shoppers. The included users are the ones who have 0 product views, and the excluded users are those who have 0 purchases. You can set the data according to your needs. For example: Which user purchased a product within a month or 12 months?

-
User Explorer
To view this report, you first need to set the user-ID feature in your properties. Once you set up the ID, you can see the data for each client with the initial data such as Sessions, Average Sessions, Revenue, Bounce Rate, Transaction, and Goal Conversion Rate. By analysing the user behaviour through this report, you can customise the customer service and product specification as per their interest.

-
Demographics
The Demographics in Google Analytics is the most crucial part of the report, as it helps in understanding the attributes of the users visiting your website, along with their behaviour. Demographics are categorised into two main sections: Age and Gender.
The overview section in the demographics shows the overall data of age and gender. The ages are divided between 18-24 yrs, 25-34 yrs, 35-44 yrs, 45-54 yrs, 55-64 yrs, and 65+years.
Whereas, gender is divided as Male and Female. The age and gender report show detailed information about the behaviour of the user according to their age. The information includes the average sessions, bounce rate, session duration, etc.

-
Interests
The interest reports in Google analytics are the place with the most beneficial information. Interest reports are divided into three categories: Affinity, In-market segments, and other categories.

The Affinity data shows the user level of interest in televisions, cooking enthusiasts, and sports fans, basically the lifestyle. The In-market segment shows the user with purchase interests. The other categories show the data by prioritising according to the users’ interests.

-
Geo
The Geo report shows the language and the location of the website. Language section shows the data for the acquisition, behaviour, and conversions for the user preferring different languages. This report is essential if you are running an international business or are planning to do it in the near future. The location section features users from different countries, cities, continents, and subcontinents. The analysis of this location report will help you understand whether the marketing efforts have been taken in the right place and correct manner. The location metric also shows a representation of the map.

-
Behaviour
The Google analytics behaviour report shows the actions of the user on the site. The behaviour report includes metrics such as New vs Returning users, Frequency & Recency, and Engagement. This report tells you more about how long a user stays on your website, how often new visitors visit the site, or how many pages are viewed by the user.

-
Technology
The technology report in Google analytics reveals the data on the type of browser that the user uses to visit your website. This information could be essential if one wants to build any application or add an extension in the browser to know the compatibility with the browser. The report shows the sessions, users, new users, and many more, coming from different browsers. One can also check the operating system, screen resolution, screen colours, flash version, and many more in the primary dimension metrics of the technology report.

-
Mobile
The mobile report shows the devices used by the audience to visit your website. The overview section of this mobile report gives you a brief on the device categories. The report shows the acquisition, behaviour, and conversion for a mobile, desktop, and tablet. It also reveals specific insights into the devices the user uses to visit the website. This report is beneficial to look at if you are developing mobile applications for any particular OS such as Android or Apple.

-
Custom
Custom reports in Google Analytics are the reports that you create. You can select any metrics such as sessions, page views, bounce rate, etc. while building the custom report. This is a more advanced report. One dimension and one metric is essential while developing the custom reports.

-
Users Flow
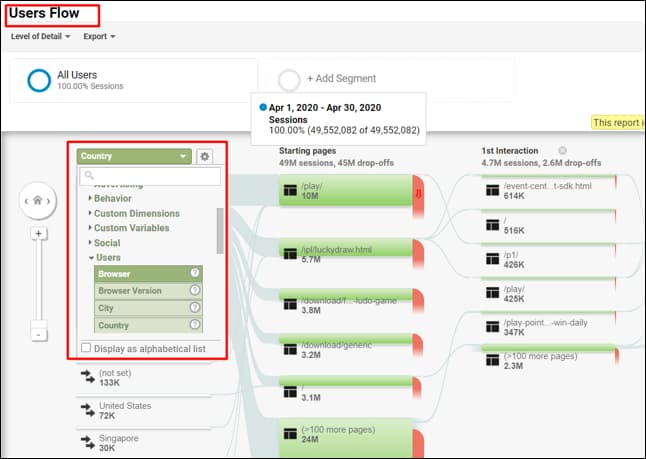
This is a unique report in Google analytics. It shows the path users take to navigate the entire website. It helps you in getting a clear perception of audience behaviour by observing which pages are losing interest in or getting stuck. The drop-down in the top left corner allows you to select the country, city, network domain, operating system, etc. and delivers the data accordingly.
Google Analytics contains essential information that your business holds, and our SEO experts use it for various SEO services. How do you track your performance? Let us know your answers in the comments below!
Popular Searches
How useful was this post?
0 / 5. 0













4 thoughts on “Google Analytics Audience Report – Complete Guide”
Hi, I read this article so very nice.
Thanks. Read our latest blogs for more updates.
Very good information, very nice.
Thanks. Check out our latest posts for more updates.